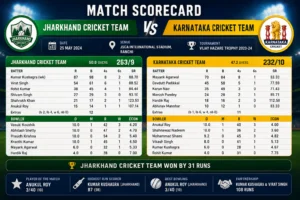
A cricket scorecard can reveal plenty about a bowler beyond wickets taken. sportstatsflow.com covers cricket scorecard topics for readers interested in match figures, bowling performances, and useful statistics. One figure worth understanding is the bowling economy rate, which shows how many runs a bowler concedes per over. It helps explain whether a bowler controlled scoring, even when wickets were difficult to find. However, economy rate does not tell the whole story by itself. Overs bowled, match conditions, batting strength, and the stage of the innings all influence its meaning. Knowing how to read this figure makes player comparisons more useful and helps fans understand bowling performances more clearly.
Understanding The Economy Rate
Economy rate measures the average number of runs a bowler concedes for each over bowled. To calculate it, divide the runs charged to the bowler by the number of overs completed. For example, a bowler who concedes 24 runs across four overs has an economy rate of six. This means the bowler allowed an average of six runs during each over. The calculation provides a quick way to compare scoring control between bowlers. However, the figure should be read alongside the number of wickets taken and the match situation. A bowler may concede a few extra runs while dismissing important batters, which can still provide considerable value to the team.
Why Lower Rates Can Help
A lower economy rate often indicates that a bowler limited the batting side’s scoring opportunities. This can create pressure because batters may feel they need to attack more aggressively against another bowler. That pressure sometimes leads to mistakes, mistimed shots, or wickets. Keeping runs down becomes particularly useful during limited-overs cricket, where every over contributes to a fixed scoring opportunity. Still, a low economy rate does not automatically mean the bowler delivered an outstanding performance. The opposing batters may have been defending carefully, or the pitch may have made scoring unusually difficult. Consider the wider circumstances before judging the numbers. Economy rate works best as one part of a broader performance assessment.
Comparing Different Bowling Roles
Bowlers have different responsibilities, so their economy rates should not always be compared directly. A fast bowler opening the innings may face aggressive batters looking to use fielding restrictions. A spinner bowling during the middle overs might focus on controlling runs and forcing mistakes. A bowler at the end of a limited-overs innings may face batters attempting boundaries on nearly every delivery. These situations create different levels of difficulty. A higher economy rate during the final overs does not necessarily indicate poor bowling. The bowler may have been defending a large target against powerful hitters. Comparisons become fairer when readers consider each player’s role, overs, conditions, and opposition.
Economy Rate In T20 Cricket
Economy rate receives considerable attention in Twenty20 cricket because each team has only twenty overs. A bowler who consistently limits scoring can make a major difference to the final total. For example, conceding seven runs per over across four overs costs a team 28 runs. Allowing ten runs per over across the same number of overs gives away 40 runs. That twelve-run difference can matter in a close match. However, T20 bowlers must balance economy with wicket-taking opportunities. A defensive approach may restrict runs but allow established batters to remain at the crease. Effective bowling often combines smart variations, accurate execution, and awareness of the batter’s intentions.
Reading Economy In ODI Matches
One Day Internationals provide fifty overs for each team under standard playing conditions. This longer format gives bowlers more time to build pressure, but they must still manage scoring throughout the innings. Economy rates can vary depending on whether a bowler operates during the powerplay, middle overs, or final overs. Early in the innings, fielding restrictions may create easier scoring options for batters. During the middle overs, teams may focus on rotating strike while avoiding unnecessary risks. At the end, batters often attack more aggressively to increase the total. A bowler’s figures should therefore be judged against the phase in which those overs occurred. Comparing only the final economy rate can hide important differences in responsibility.
The Difference Between Economy And Average
Economy rate and bowling average describe different parts of a bowler’s performance. Economy rate measures runs conceded per over, while bowling average measures runs conceded per wicket taken. A bowler may have a low economy rate but take few wickets during the match. Another bowler might concede more runs but dismiss several important batters. Neither statistic automatically proves that one player performed better. The match situation determines which contribution mattered more to the team’s needs. Bowling strike rate is another useful figure because it measures how many balls a bowler needs, on average, to take a wicket. Reading these statistics together provides a more complete view of bowling performance.
Checking Scorecard Bowling Figures
A detailed scorecard usually lists overs, maidens, runs conceded, wickets, and economy rate. Readers should confirm that they are examining the correct innings and competition before comparing figures. It is also important to understand how extras are treated in bowling statistics. Wides and no-ball penalties are generally charged to the bowler, while byes and leg byes are not charged in the same way. This can explain why the team total differs from the combined runs charged to bowlers. Some scorecards display figures in a compact format, so checking the column labels helps avoid confusion. Accurate reading matters when comparing performances across different websites or match reports.
Avoiding Misleading Comparisons
One common mistake is treating the lowest economy rate as proof of the best bowling performance. A bowler might have delivered only one over, making direct comparisons with someone who completed a full spell unfair. Conditions also affect scoring, including pitch behavior, ground size, weather, and the opposition’s approach. A low-scoring match can produce lower economy rates across both teams. In a high-scoring game, even skilled bowlers may concede more runs than usual. Readers should compare similar roles and formats whenever possible. Reviewing wickets, overs, and match context alongside economy rate reduces the risk of drawing misleading conclusions from one statistic alone.
Conclusion
Bowling economy rate helps readers understand how effectively a bowler controlled scoring during a cricket match. Lower figures can indicate pressure, but wickets, bowling roles, and conditions also matter. Comparing economy rate with bowling average and strike rate gives a clearer picture of performance. Scorecards become more useful when these figures are considered together rather than judged separately. The next time you review bowling statistics, look beyond the lowest number and consider what happened during those overs. For more cricket scorecard information and match-related statistics, sportstatsflow.com offers further content for cricket readers.
Read also :-